Sapiens.BI helps you produce effective reports with charts in a fast and easy way. It is a Sugar and SuiteCRM BI plug-in with powerful reporting capabilities, ease of use, elegant design, and a quick and easy setup. This Reporting Tool is easy to use, there is no need for technical knowledge or SQL. The Sapiens.BI tool comes with over 100 pre-built reports.
New upgrade of Sapiens.BI PRO (October 25, 2016)
We are happy to announce the latest upgrade of Sapiens.BI PRO version with the following new features added:
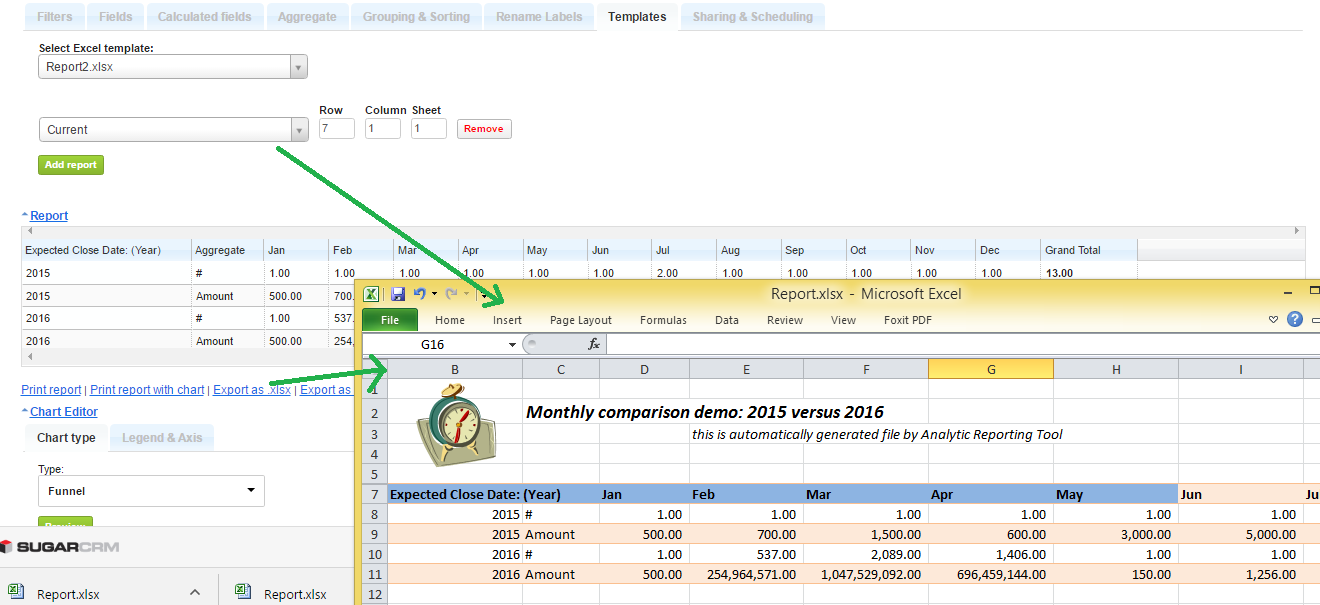
- You can add your own formatted Excel templates
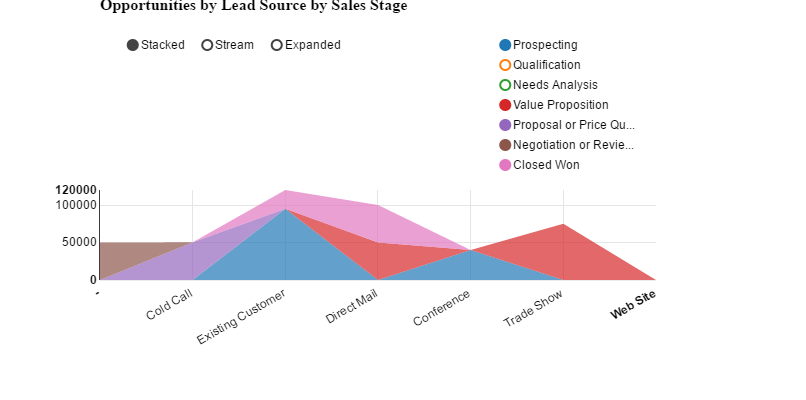
- New chart types: Area chart, Horizontal Bar Chart (in addition to already existing chart types of: Pie, Line, Column, 3-axys chart, Geographic, Funnel, Gauge)
- Additional filters: team, # of passed weeks, months, quarters
- Permissions to edit selected filters for read-only users
- Calculated function script can be edited manually, and other improvements
- PRO version is now compatible with MS SQL
Please read detailed visualized instruction for more detailed information.


