Sapiens.BI helps you produce effective reports with charts in a fast and easy way. It is a Sugar and SuiteCRM BI plug-in with powerful reporting capabilities, ease of use, elegant design, and a quick and easy setup. This Reporting Tool is easy to use, there is no need for technical knowledge or SQL. The Sapiens.BI tool comes with over 100 pre-built reports.
Powerful Reporting for SuiteCRM
You likely have massive amounts data in your CRM, but do you have the ability to extract it in a meaningful way? You may have tried various other reporting tools that were clunky, required in-depth technical knowledge, or simply never worked.
We understand your pain so we created Sapiens.BI which has quickly become the most popular reporting tool for all editions of SuiteCRM out there.
Take a look at our features below, request a demo, and start your free trial today. We have included over 100 pre-built reports to help you get started right away.
Why Use Sapiens.BI?
We Are Here For You!
- Free training for your specific needs
- Video tutorials available if you want to learn at your own pace
- Always-there-for-you support. We will always be there to help you with your needs
Features
- Various pre-defined reports are available for most of the SugarCRM modules containing different summary types and chart types
- Supports MySQL and MSSQL
- Supports SuiteCRM and SugarCRM including On Demand instances
- Supports custom modules and fields
- Modify any of the existing reports or you can copy an existing report to create a new one
- Add/remove fields or columns to be displayed in a report
- Choose what needs to be summarized, counted (count of unique values or count-all) or calculated as min, max, and average value
- Filter your report data to see a specific date range, status or any other option (e.g. by team)
- Report on audit tables/change logs
- Create your own functions and calculations
- Create detailed, summary and pivot (matrix) reports
- Create Snapshot reports from audit history data
- Combine Calls, Meetings, Tasks etc. in the same report
- Choose report grouping and summary options, incl. the grouping order
- Identify what should be displayed as a row and what should be a column in your report
- Identify the order for unlimited grouping and summary levels
- Chart types: Pie, Line, Bar, Horizontal Bar, Area, Combined (Multi-axis), Funnel, Gauge, and Geographic
- Change chart types and set what data should be displayed on which axis
- Summarize and compare data from various modules within a single report and chart
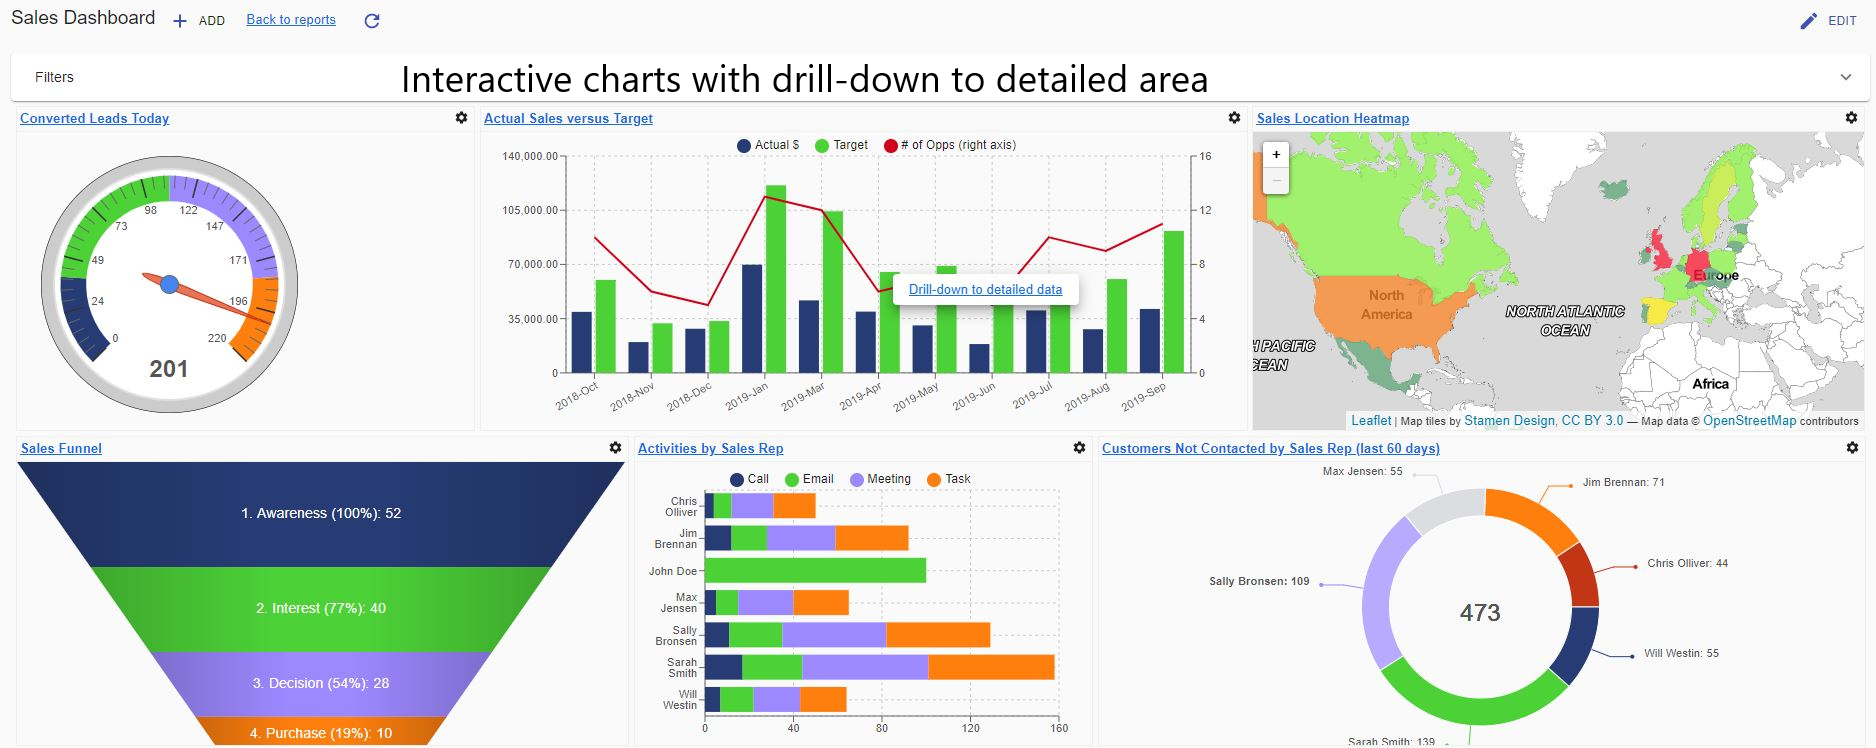
- Interactive charts: on mouse-over or click on a specific chart area, a small tooltip will show you the name and amount of the corresponding area
- Reports can be exported to Excel or PDF, you can add your own custom formatted Excel templates
- Charts can be saved as pictures
- Charts can be added to the SugarCRM Homepage
- Identify your own ranges for report summaries (e.g. to be summarized by size 1-1000; 1001-2000; 2001 and more etc.)
- Calculate % from totals
- For each report you can set permissions for individual users or user groups to view-only or edit
- Schedule regular report auto-creation and emailing as a link and/or PDF/Excel attachment to selected users
- Reports are organized in folders. You can move reports between folders. You can edit/delete folders and you can create your own folders and sub-folders.
- Permissions to reports (view, edit), module data owners (assigner/created user/role/team), permissions to filters.
Free Training
Reporting can be overwhelming. Having helped hundreds of companies just like yours we appreciate the unique challenges that you face. Because of that, we offer free training as part of starting a trial for Sapiens.BI PRO.
- Overview of the reporting capabilities
- How to use those capabilities for your unique reporting needs
- Answer any questions you have along the way
Schedule a Demo
Wow, that is a long list of features. And it can be hard to fully grasp whether this will fit your needs. So if you would like a personal demo to walk through everything and show you how our tool can work for you drop us a line and we can set up a personal demo session with you.
User Guide and Video Tutorials
To see all that you can do with Sapiens.BI Pro be sure to download our User Guide PDF
or Visit Video Tutorials page for easy learning and start using the tool
Screenshots
![5 Regularly Scheduled PDF Excel attachments in your mailbox[5963].png 5 Regularly Scheduled PDF Excel attachments in your mailbox[5963].png](https://store.suitecrm.com/assets/img/addonassets/sapiens-bi-pro/5%20Regularly%20Scheduled%20PDF%20Excel%20attachments%20in%20your%20mailbox%5B5963%5D.png)
Sapiens.BI Dashboard

Combined Chart
Combined chart with 3 axes (2 vertical axes): for comparison of different scales, e.g. Count and Sums:
![Combined_Chart (1)[5959].png Combined_Chart (1)[5959].png](https://store.suitecrm.com/assets/img/addonassets/sapiens-bi-pro/Combined_Chart%20(1)%5B5959%5D.png)
Customization Options
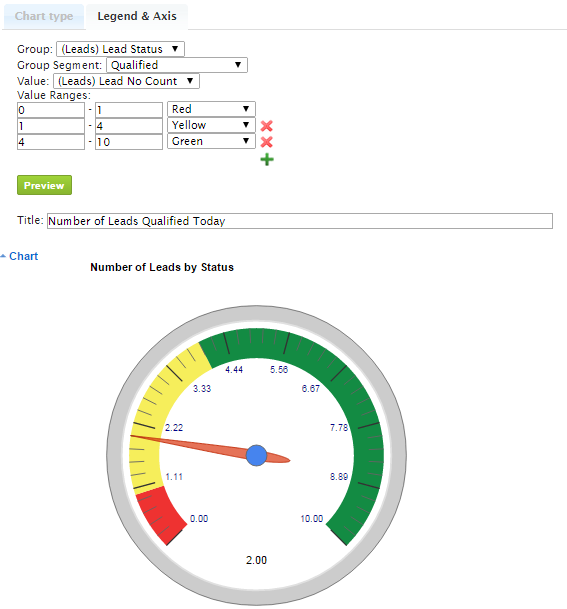
Reports and Charts have lots of customization options. For instance, this is how you identify ranges and colors for the Gauge Chart:

Numerous Export Options
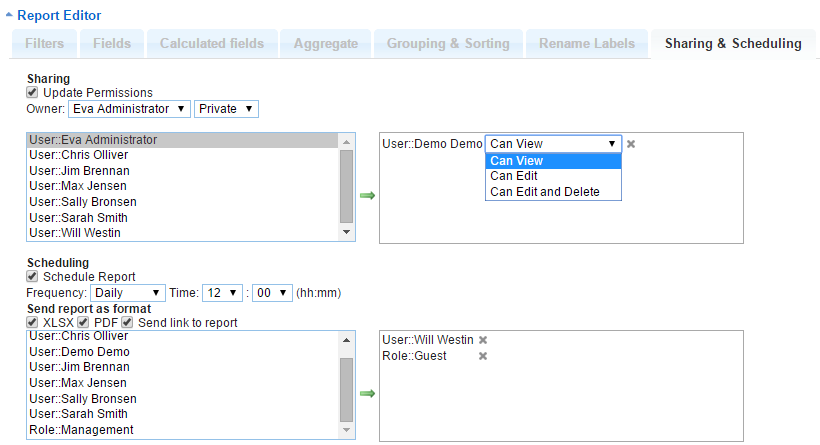
Reports can be exported in Excel and PDF formats. They can also be Scheduled via e-mail as PDF and Excel attachments, and/or Links to the reports. PDF and Excel e-mailed reports are real-time, i.e. if your report has the filter set to Last Month and runs monthly, it will e-mail the previous month's data every time it is run:

E-mail Scheduling
Mass edit for Permissions and E-mail Scheduling: you can select several reports at a time and update Permissions and Scheduling for all selected reports.
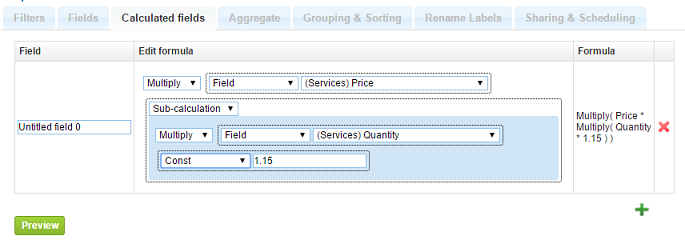
You can calculate your own values (Add/Subtract/Multiply/Divide Fields and Constants):

Pricing
We believe in data-driven decision making and want to make sure you get the most out of the Sapiens.BI tool. This is why we offer free training and Always-there-for-you support. To ensure that Sapiens.BI PRO is priced fairly for all business sizes, we price based on the total number of users in your CRM. You can find pricing and start a free 30-day trial here. After starting a trial, you will be able to schedule your free training session.


