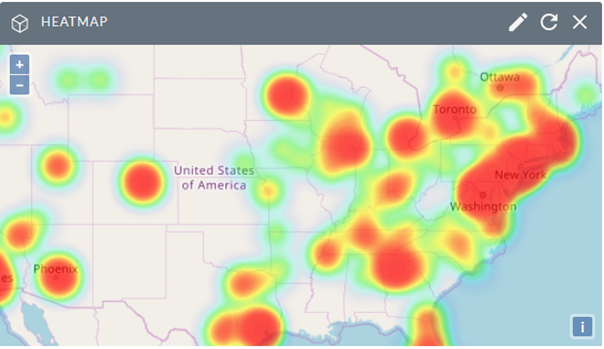
Visualizing your SuiteCRM geocoded data is now easy! With this Heatmap dashlet you will be able to easily identify clusters of data on a map based on the density of the data points and optional data points weight.
Introduction
Heatmap documentation
Install Heatmap add-on according to its installation instructions. Make sure you activate Heatmap. Go to Admin->Heatmap activation to activate it.
Getting started
From the Home Page (dashboard) expand Actions and hit Add Dashlet.
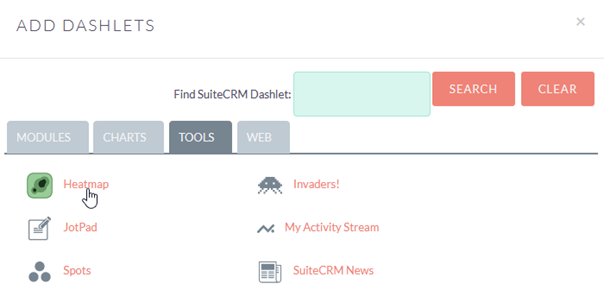
You can find Heatmap dashlet under the Tools category. Click Tools tab and hit Heatmap to add dashlet to your dashboard
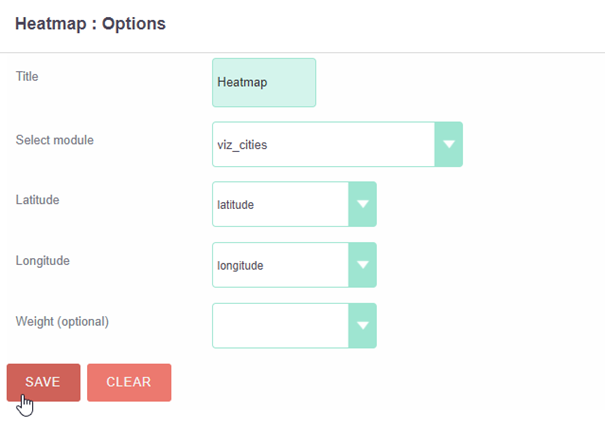
Once Heatmap is added, it needs to be configured. Hit dashlet config icon  to open its configuration window.

There are three mandatory fields which have to be configured for the heatmap to show graphical information - Select module [module name] – the module which contains geolocation data - Latitude – module field which stores geographic latitude of data record - Longitude – module field which stores geographic longitude of data record
Weight
Weight is used to derive the weight of one point in comparison to the other data points. Common weight fields are: population, rating, income, age, sales results etc…Higher weights mean greater heats on the map. Weight should be a numerical field.
Hit Save to create and save heatmap configuration. Click dashlet refresh icon  to reload it.
Heatmap should now show graphical visualization based on your data.
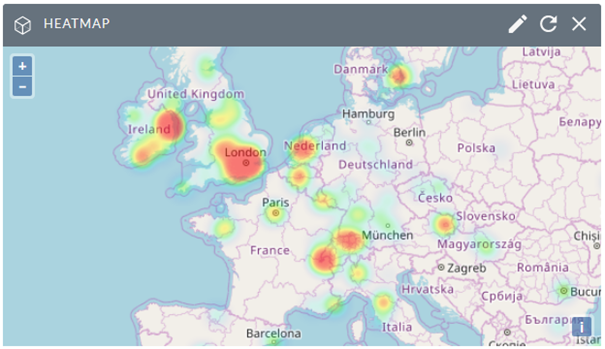
The vizualization can be further customized using heatmap display options. Hit display options icon  to open its display config window.
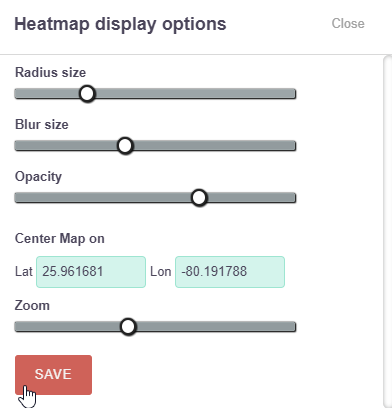
With different range type inputs you are able to customize your heatmap view according to your needs and see the results on the fly.
Radius, Blur, Opacity These options define how features are rendered on the map - Radius – radius size in pixels of single feature. Default is 8 - Blur – blur size in pixels of single feature. Default is 10 - Opacity – opacity 0 - 1. Default is 0.5
Map center and zoom You can zoom and center the map to particular point by configuring point coordinates and zoom level.
Change all of these display options and see the results directly on the map. Hit Save when you finish and your configuration will be stored in the system.
Download full documentation here: Download Heatmap Installation and User Guide


